Tips and tricks for reducing server response time

In the process of optimizing a website for search engine queries, as well as the current requirements of the consumer market, all specialists pay attention to a huge number of tasks. They think through the content, work on graphical improvements, and do everything to improve the ease of use of the resource for people. And one of the important parameters here will be optimizing the site loading speed, in particular, server response time. If these points are not given proper attention, then even the most high-quality and well-thought-out website, filled with useful information, will turn out to be completely unsuitable for users due to the fact that they simply won’t wait for it to load, that is, they will go to your competitors to find the necessary information.
In today’s review, we’ll talk about what a parameter called site loading speed is, we’ll tell you how to measure it, and also how to improve this indicator, thereby increasing the ease of use of your resource for ordinary people.
What are site loading speeds
In this case we are talking about such an indicator as TTFB (Time To First Byte). This is the time it takes for the server to send 1 byte of data in response to a user request. Today, it is by this indicator that the performance of Internet resources in general is determined. Therefore, this is what we will talk about in our review.
Today, when assessing website loading parameters, TTFB indicators can be called one of the most important. Moreover, they have a direct connection not only with how satisfied users are with working with your resources, but also with the position of the site in search results. This trend appeared quite a long time ago, but has not lost its relevance for many years.
Moreover, TTFB — This is a standardized indicator. In particular, according to the recommendations of the Google search engine, it should be no more than 200 milliseconds. But the system recommends aiming for 50 milliseconds. This is the figure that is considered normal today and acceptable both for a positive assessment by search bots and people. If in practice it turns out that the response time will be longer than these indicators, then you should not leave everything to chance. It is necessary to figure out what is the cause of this problem and eliminate it. If this is not done, the position of your site will gradually begin to decline in search results, which will negatively affect the stability of your income.
Now let's talk about how to check the TTFB indicator.
Checking the TTFB indicator
In their work, modern SEO specialists use more than one method to check the TTFB indicator. We will now highlight three solutions that will be the simplest and most convenient in practice:
- Using browser developer tools.
- Using specialized online services.
- Through the Netpeak Spider platform.
Each of these options has its own subtleties and nuances, so let’s look at them in more detail.
Determining TTFB indicators through browser developer tools
To use this method of determining the TTFB indicator, you need to open your site in one browser or another. In the example we will show the features of working through Google Chrome:
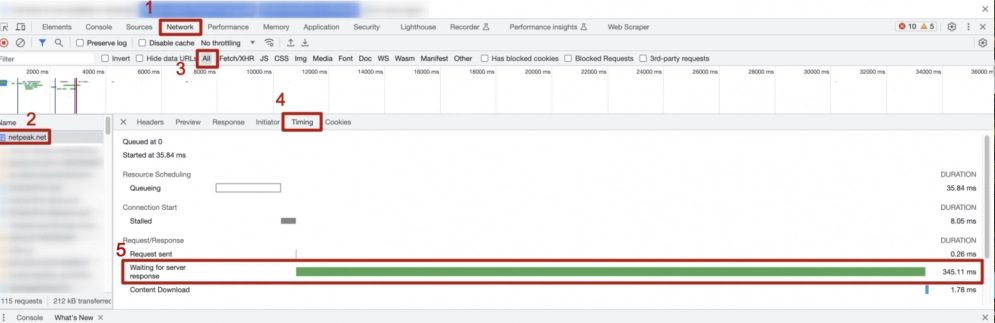
So, initially we right-click on any part of the active window, that is, on the page of your site and from the drop-down menu select the “Check” option. You can also use the key combinations “Ctrl+Shift+I” or “Cmd+Opt+J”, if you are using a Mac book. After this, perform the following steps:
- Go to the “Network” tab, after which we update the active page. In the block with filters (third horizontal row at the top of the active window), select the ALL option.
- In the “Timing” block (fourth horizontal row) we also need to select the page that is currently loaded in your browser.
- After this, additional options will open in front of you. Look closely at the list of requests, and here you will see a request going to your server. Let’s look at the line “Waiting for server response” and here we see the current TTFB indicator given in seconds.

In principle, there is nothing complicated or incomprehensible in this method. Moreover, it allows you to find out the information you need without using third-party resources. But there are also faster and more informative ways to find out the TTFB indicator.
We determine the TTFB indicator through specialized online services
Today there is a fairly large number of online services and tools on the market, using which you can quickly and easily check not only the TTFB indicator, but also find out a lot of other information about the performance of your own Internet resource, which will be useful at the stage of its optimization. Please note that among them there are both paid and free analogues. Often, paid services will have more advanced functionality. Explore several options to choose the one that is most effective and convenient for you.
Now let's look in more detail at such a tool as WebPageTest. The service is simple and easy to use and will require minimal settings from you. To start analyzing a page with its help, you just need to enter the address of your site, or rather some of its pages, in the appropriate url line. Just a few seconds for the analysis itself and you just have to go to the “Page Performance Metrics” section. to see the TTFB indicator.
Relevant information will also be presented in the “Real-World Used Metrics” block. simultaneously with other website performance characteristics. Despite the fact that the interface of this service is in English and there is no Russian version, everything here is so simple and intuitive that you are unlikely to have any problems with your work.
Another good tool for determining TTFB and other related characteristics is PageSpeed Insights. But again, there are a lot of options, and you yourself choose the one that will be the most convenient and functional for you.
Determining the TTFB indicator using Netpeak Spider
Netpeak Spider — one of the most functional tools designed for comprehensive analysis of Internet sites. Every SEO specialist and others will find many useful solutions here. The developers have tried to make sure that here you can get a complete set of data that allows you to analyze the site, as well as optimize it for search engine optimization. Among other things, there is also a section dedicated to analyzing site performance.
In order to estimate the TTFB indicator with its help, you will only need a couple of minutes of time, as well as consistent adherence to our recommendations:
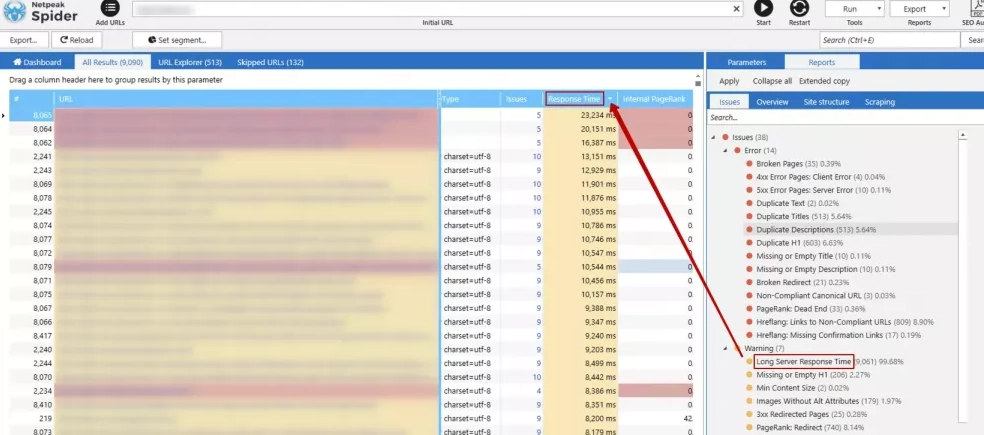
- Launch the Netpeak Spider application. Enter in the appropriate line the URL of the page you are working with at the moment. We start the scanning process.
- Wait a few seconds and the scanning is completed. To find out its results, you need to go to the section with reports or to the block where the analysis results are stored.
- So, the scanning report will contain the entire set of data about the Internet resource itself, including all parameters that are directly related to page loading time. Among other things, the TTFB indicator will also be present here.
If you want to work in more detail on certain pages and sections of your site, you can use the settings and filters of this service. In this case, you will receive more extensive information, which will become the basis for your subsequent actions.
If we compare Netpeak Spider with other analogues, here, first of all, users highlight the simplicity and ease of use, as well as very broad functionality. We would like to draw your attention to the fact that when checking the TTFB indicator and site loading speed in general, it is important for you to focus not only on the main page of your resource, but also on those sections that are most often visited by the user audience. These could be product cards, a section dedicated to contact information, methods of payment and delivery of orders, blogs. After analysis, you can see that the server response time for different types of pages may be different. See why this happens. If you find the reason for such a delay, you can improve your performance.
Why TTFB is high: main reasons
High TTFB — this means that your site's performance leaves much to be desired. But it’s clearly not worth putting up with such a situation. First of all, you need to understand why you encountered such a problem, and then eliminate it and improve existing indicators. Thus, among the main reasons that can negatively affect the performance of an Internet resource, we highlight:
- The page contains too much data. In many ways, this will apply to graphic content, the optimization of which has not been given enough attention. Regardless of what your site is dedicated to, the presence of heavy images on it that you have not optimized for online placement in advance can significantly slow down the page loading, thereby increasing the TTFB indicator.
- Your hosting is too slow. Perhaps, in order to save money, you chose a rather weak hosting or opted for shared hosting. This can also negatively impact site performance in general and, in particular, reduce TTFB. Often a similar phenomenon is observed on hosting sites that are overloaded with other sites, especially powerful ones. Therefore, in order not to optimize the site loading speed later, for this reason it is better to initially choose a good hosting.
- There are problems with the server configuration. We cannot rule out the possibility that the server was configured incorrectly or that it has an unoptimized software stack. Examples of such a solution would be Apache or Nginx. Practice shows that they can cause a noticeable delay in processing user requests, which will negatively affect both site performance and the TTFB indicator.
- Database failure. This phenomenon is not uncommon in practice. If indexes are not optimized, if you use inefficient or too slow database queries, you can significantly reduce your TTFB. This is especially true for those pages that automatically access the database when loading.
- Presence of network delays. We have already repeatedly said that the remoteness of a real user device from the territorial location of the server — This is one of the most important indicators that affects the site loading speed. Everything is clear here: the greater the distance that requests and responses need to travel, the higher the TTFB indicator will be. The situation in this case can be improved somewhat by using Content Delivery Network (CDN).
- Scripts and code are located on the server side. Experience has shown that inefficient code placed on the server side can also contribute to significant delays, as can a large volume of user requests that go to the same server at the same time. This is more of a problem with the provider. It must balance the load so that such a phenomenon does not occur.
- Your site does not use data caching. In this case, with each new request, the server will need to re-generate all the pages, which in itself will lead to significant TTFB delays.
Also, in practice, there have been more than once situations where the performance of a site was significantly reduced due to incorrect DNS record settings or errors made in SSL-certificates. We must also not forget about possible hacker attacks involving the simultaneous sending of a huge number of requests to the same server, as well as the usual technical problems that any hardware can encounter. This is something that also affects the TTFB indicator and the loading speed of the site as a whole.
Therefore, the first thing you need to do if it turns out that your TTFB is too high is to conduct a comprehensive analysis of the resource and check all the aspects that we talked about above. Move systematically from one to another so as not to miss the real cause of your problem.
TOP ways to optimize site loading speed
To optimize site loading speed and TTFB indicator, in particular, you can use different methods. They largely depend on what was the cause of the problems identified on your resource. But there are still a number of basic recommendations, in particular:
- We choose exclusively reliable and fast hosting. Surely there is no need to warn that the site should not be hosted on free hosting. Also, hosting that is used simultaneously by several sites and those options that have limited functionality will not be the best solution. Only a high-quality hosting provider that provides fast servers and has a meticulously thought-out infrastructure can guarantee you high site loading speed and, accordingly, a lower TTFB. If your site is planned to be heavily loaded, then using a VPS (Virtual Private Server) would be an appropriate solution.
- Improve the code and the queries that will be sent to the database. We would like to draw your attention to the fact that the efficiency of the code should be improved directly on the server side, as well as all requests that will be sent to the database. Perhaps the most efficient solution would be to reduce the complexity and number of queries. Thus, many experts recommend setting limits on the number of redirects. The optimal indicator here would be 301 redirects. If their number seems higher, then the system will not automatically terminate these requests. To optimize database indexes, you should use data caching.
- If the problem with the server response is hidden in poor performance associated with low RAM or a weak processor, then the only thing you can do in this situation is to upgrade your hardware. It turns out that your server is too old and there are no longer enough capabilities to work with your site.
- Connect Content Delivery Network (CDN). This is a graphically distributed network infrastructure with which you can significantly speed up sending content from the server to the end user by minimizing the distance between the server itself and the user device.
- Do not neglect server and browser caching. If you organize data caching both on the server side and directly on the client device, you will be able to significantly reduce TTFB indicators. The very essence of caching is that you can save the results that the server has previously prepared in response to user requests, thereby eliminating repeated calculations on the server if it happens that the same request comes to you again.
- Configure load balancing. This recommendation is relevant if you use several servers. If you think carefully, you will be able to distribute all the load that will go on the machines more or less evenly. Thanks to this, you will be able to avoid problems associated with the fact that one of your servers will be constantly under increased load, while the others will, so to speak, rest. Accordingly, the TTFB indicator will be noticeably reduced.
- Take advantage of PHP accelerators. In this case, we are talking about specialized software solutions designed to significantly speed up the execution of PHP code, which will automatically reduce the load on the server and, as a result, its response time to user requests. The very essence of PHP accelerators is that they cache compiled PHP scripts. This eliminates the need to constantly recompile PHP code and execute it when users access the server. In this case, the compiled code will always be in the memory of your server and you will be able to use it on subsequent requests. As a result, server performance will increase significantly, which will lead to a decrease in TTFB. This solution will be especially relevant for Internet portals that are constantly subject to high loads, as well as for various applications that use large volumes of PHP codes. To use this solution in practice, you will need to install the PHP accelerator on your device and perform its basic settings. Among the most popular solutions here, we highlight Zend OPcache, PhpExpress, APC (Alternative PHP Cache), Windows Cache Extension for PHP XCache, eAccelerator.
- Improve your server configuration. It is within your power and capabilities to configure your server so that its performance in practice is truly as high as possible. The most common solutions that should be used in this case include combining external JavaScript files and CSS code. There is a simple rule here: the fewer files there are, the higher the download speed will be and the number of additional requests will be reduced. If you move the internal JavaScript and CSS fragments from the code into external merged files, you will also improve the loading speed of the site. Another solution at the stage of improving the server configuration — This is a compression setting directly on the server. There are separate tools for different devices. In particular, for Apache you can use the mod deflate tool, and for Nginx — HttpGzipModule tool. It is worth setting up HTTP compression on IIS servers. Please note that Cloudflare's network servers will perform file compression. This will automatically also include the use of compression algorithms such as Brotli and Gzip. YUI Compressor tool — this is what will allow you to shorten and improve JS and CSS files. Once you use the file compression and caching options, you will certainly be able to see how much more efficient your server has become in processing user requests.
- Regularly monitor the performance of your resource, also the TTFB indicator. We have already talked about how to do this above. That is, you must understand that you are faced with more than one-time work. If you want your site to work as stable as possible and to instantly provide answers to user requests, you need to monitor its operation constantly.
- All plugins and scripts that you do not use in your work should be deleted immediately. Get into the good habit of checking these parameters at regular intervals. As soon as you identify non-working ones, you can safely delete them. This will also help improve site loading speed and reduce TTFB.
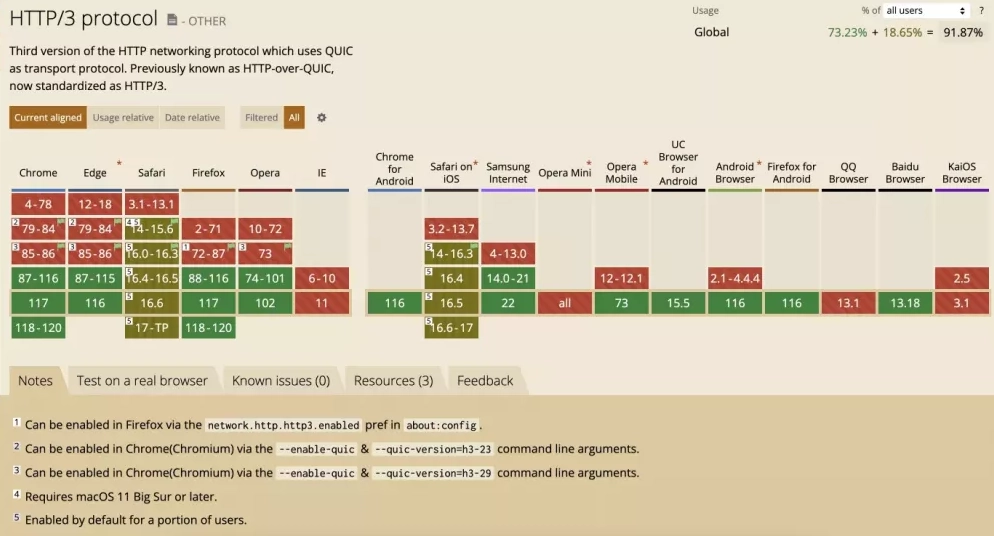
- Switch to HTTP data transfer protocols versions 2 and 3. They are able to support a large number of requests, which ultimately will significantly increase the site loading speed. So, if in your work it turns out that the site does not pass the CWV metrics check, then the first thing you will need to do is update your connection protocol to a higher version. By the way, HTTP 3 introduces the ability to transmit hypertext. By default, this option will be available in all Chrome browsers starting in April 2020. It also implements QUIC technology for even faster and more efficient data transfer. But before updating the protocols, you must make sure that both your server and the hosting you are working with support this version. Pay attention to the picture below. The most popular browsers are listed here, and their versions are indicated by numbers. If they are highlighted in red, then the browser does not support the HTTP 3 protocol; if they are green, then it does. The khaki color will indicate that the support is partial. It remains to evaluate from which browsers or devices the majority of users access your site in order to understand whether it is worth switching to version 3 of the protocol or whether it would be a more reliable solution to remain on version 2. And do not forget to use an exclusively secure version of the protocol (HTTPS) in your work ), regardless of his generation.
To summarize
As you can see, there are a lot of reasons for the decrease in TTFB, as well as ways to solve this problem. But alas, identifying this problem is not as easy as it might seem at first glance. In your work, to find out the indicators you need, you will have to systematically check all the features, eliminating them one by one. The only thing that will help you significantly simplify this work is regular work with the resource and its timely optimization. This is the only way you can get a website that will respond to user requests as quickly as possible, causing a high level of satisfaction on their part.
Among the basic recommendations that can be given here, we highlight:
- use of exceptionally reliable and stable hosting;
- optimization of the code and all queries that will go to the database, specifying the maximum redirect indicator;
- caching settings;
- optimization of graphic content;
- regular removal of plugins and scripts;
- use of PHP accelerators, etc.
In the review itself, we examined all these aspects in as much detail as possible. You just need to use the recommendations given to significantly simplify your work and avoid various difficulties with the speed of loading the site.
But in order to significantly simplify all the work associated with monitoring the operation of the site, reduce the time and your own efforts for their implementation, we recommend using a tool such as mobile proxies, in particular from the MobileProxy.Space service.
With its help, you can automate many routine tasks and provide yourself with access to sites from different countries and regions of the world. A high level of anonymity and security on the Internet is also guaranteed. You will have over 2 million IP-addresses at your disposal, as well as a huge number of geolocations from different countries and regions of the world. You will be able to change them as often as you need directly in the workflow. Follow the link https://mobileproxy.space/en/user.html?buyproxy to learn more about this solution and use free two-hour testing. Thanks to 24/7 technical support. All issues that will arise when using mobile proxies will be resolved as quickly and efficiently as possible.
Take advantage of the MobileProxy.Space service and see how technologically advanced, functional and effective the solution is at your disposal to perform work related to website optimization and more.