TOP-8 Google Analytics reports for blog

The article content
Google Analytics — This is an extremely popular platform today for collecting data from applications and websites, as well as their subsequent structuring and generation of information reports for business. With its help, you can track the statistics of your website, identify a number of patterns and trends that have both positive and negative impacts on the development of your business. With this information, you can improve your overall development strategy, optimize your site, and increase its operating efficiency. Today Google Analytics offers a fairly impressive set of reports for different areas business, types of sites.
Now let’s look in more detail at how to analyze the effectiveness of a blog using this service. Here are 7 types of reports that everyone who works with such pages should use. Here are recommendations for making the settings. The information received will allow you to perform these tasks as correctly as possible, which means you will receive truly reliable and useful statistics.
Popular blog reports from Google Analytics
Almost every site presented on the Internet today contains such a section as a blog. This solution has several goals:
- placement of affiliate links or advertising on the site;
- increasing brand awareness;
- selling services, which is especially important for companies operating in the B2B segment.
Also, having a blog and regularly updating it with new material is positively assessed by search bots. They perceive this as work on the resource, which ultimately affects the improvement of indexing, that is, the visibility of the site and its promotion to the top of search results.
You can evaluate how your blog is performing using one of the most popular Google Analytics Audience/Review reports. It is widely used by Internet marketers, as well as many other specialists, in order to understand how many people visited the site, how many first and repeat visits were identified, the total number of sessions, and their duration. You can also use this report to sort your audience according to various criteria. But to understand the overall picture and determine the effectiveness of your blog, the capabilities of this report will clearly not be enough. That is why we invite you to get acquainted with eight additional reports that will also be useful in your work:
- Cohort analysis.
- Comparison - Channels.
- Location.
- User statistics.
- Content group.
- Site loading speed.
- Login pages.
- Publishers.
Let's look at the features of each of these reports in more detail and show you how to correctly make the appropriate settings.
Cohort analysis
This report provides information about what percentage of users return to it again after their first visit to your resource. This information does not have any specific relation to remarketing channels, but it allows you to determine the effectiveness of tools designed to notify the audience about the appearance of new articles on the blog.
Surely you, as business representatives, should not once again point out that one of the most important factors in expanding your audience will be the retention of regular users. That is, if you understand the distribution of new visitors and those who return to you, if you compare these readings from week to week or from month to month, you can see whether your core readership is expanding. That is, you must understand that your most loyal audience — these are subscribers. These are those who are more likely to buy your product, since at that time they will already be confident in your expertise, will be well acquainted with your company, the goods and services provided.
To find this report, you need to go to the Google Analytics service, go to the “Audience” section, and then select “Cohort analysis”. Here you need to perform a number of basic settings in order to obtain statistical data. There are 4 separate criteria for this. You must be well versed in them in order to get in the report exactly the data that you need at a given time:
- Cohort type. The date of the first visit is most often indicated here. It will display information about users who made their first visit in the time interval that you also specify in the settings.
- Cohort size. If you select the “By weeks” option, you will be able to track statistics for this particular period of time. There are also options here such as day and month. But practice shows that the best solution would still be to study statistical parameters on a weekly basis. That is, this is the optimal cohort size, which will also include taking into account the difference in the number of visits on weekdays and weekends.
- Indicator. In this case, it would be best for you to choose the customer retention rate, because using it you will be able to track exactly the parameter that interests you, namely the dynamics of customers who return to the site again.
- Date range. This is the period of time for which you want to see statistics. We would like to draw your attention to the fact that it is this interval that will be taken as the basic settings in the “Cohort Type” block.
After you run the analysis itself, you will receive the report itself in the form of a table with statistics. The first column of the table will be called "All Users" and it will display the number of people who visited your site in the time frame you selected, as well as the number of users for each week. All other columns — this is the dynamics of changes in the retention rate of blog visitors and readers from the first to the last week. That is, here you will see how many people initially visited your site, what percentage of them returned after a week, after 2, and so on throughout the entire time interval that you specified.
Data can also be displayed in the form of a graph. The figure shows the results of research over a one-week period.
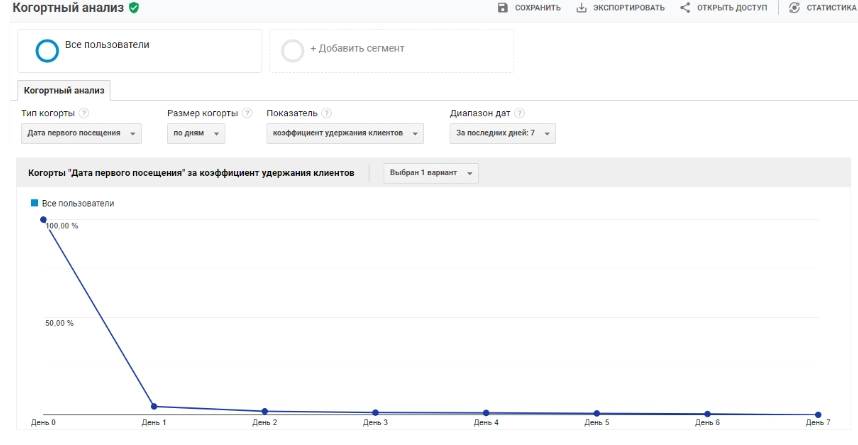
The information obtained can be used by you to analyze how effectively your remarketing tools are working. That is, you will be able to compare the results obtained before running this tool and after a certain period of time after that.
Comparison - Channels
This report will provide you with information that will help you analyze the effectiveness of your blog by comparing the main metrics of your site with parameters obtained from competitors’ resources – benchmarks. In this case, you will have the following information at your disposal:
- average traffic figures for your niche as a whole;
- average data on failures in the same niche;
- average duration of user stay on the site;
- conversion channel that attracts the largest number of users.
This information will be enough for you to determine which indicators of your resource are better than those of competitors, which are worse, and which need additional work.
You can find this report in the same “Audience” section.
To correctly perform the necessary settings, you need to select the following metrics:
- Industry. This is exactly the niche in which you work. Just click on the drop-down list and select the option that suits you.
- Country/region. Here you can also select the country for which you want to receive analytical data or a separate region.
- Range of number of sessions per day. This indicator will be individual for each site, as it will reflect the total number of visitors. The range here is quite wide, on average up to 500. That is, you can easily choose the right option for yourself.
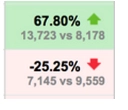
As a result, you will receive a report also in tabular form. The first column will contain a group of channels through which the check was performed, and then – traffic sources and behavior. Those parameters that you have better than the benchmark indicators for the niche will be highlighted in green with a green arrow up, and those that are worse — pink with a red arrow down. That is, you will see your strengths and weaknesses in the niche as a whole.
Location
Using this report, you can determine from which region the most users come to your block. Imagine the situation that your blog is in Russian, and most of the transitions to it come from Great Britain. This situation is not particularly typical, which should make you wonder, why is this happening? There is a possibility that this is a hack, that is, Googlebot, when entering the site, sees all your content in English.
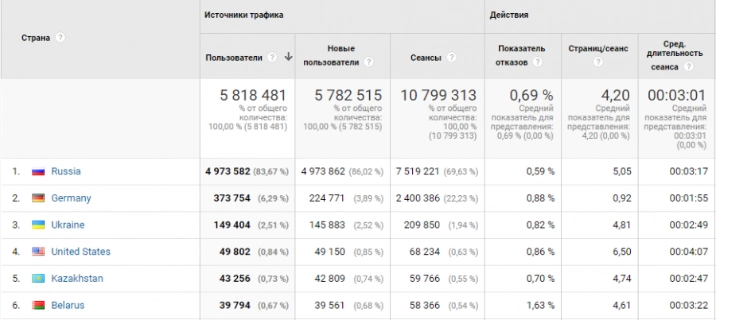
You can find this report in the same “Audience” section. Next, select the “Geography” block, and in it you will find “Location”. The settings here are very simple. You just need to select the date range for which you want to receive analytics. Run a check and get a list of countries from which your blog receives the most traffic.
User statistics
A very useful report that allows you to track the path of users from their first seconds of entering your site until the end of the session. Also, the data obtained will allow you to analyze sessions with different failure rates, different durations and identify the relationship, if any.
You can find this report in the “Audience” block. Here it is labeled “User Statistics”.
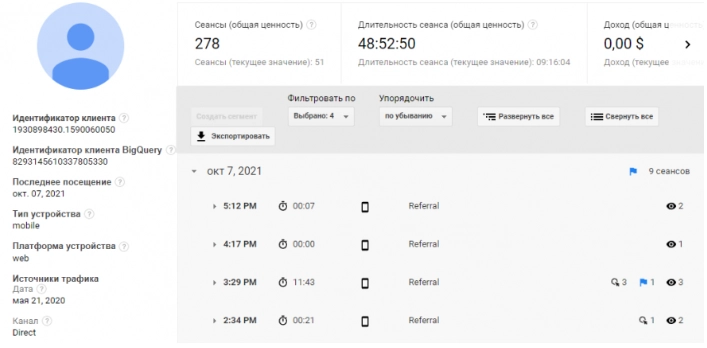
In order to obtain the most complete and accurate information for each individual user using this report, you need to initially click on the client’s personal identifier — Client ID. This is a digital indicator that is automatically assigned to each site visitor. But it does not contain any data about the very identity of the person. That is, user privacy is maintained. In Google Analytics, this identifier is present by default and anyone can use it.
That is, you just need to click on your visitor’s ID number to get detailed information about all his sessions for the period you selected. You will receive data such as:
- total number of sessions;
- duration of one session;
- the income that it brought to your company (relevant for cases when a purchase of a product or service was made);
- type of device from which the entry was made and its operating system;
- source traffic;
- traffic channel.
That is, you will see from which channel this person came for the first time and through what source he returned, what profit he brought to your company. Thanks to this, you will be able to identify those traffic channels that give the greatest results for your site.
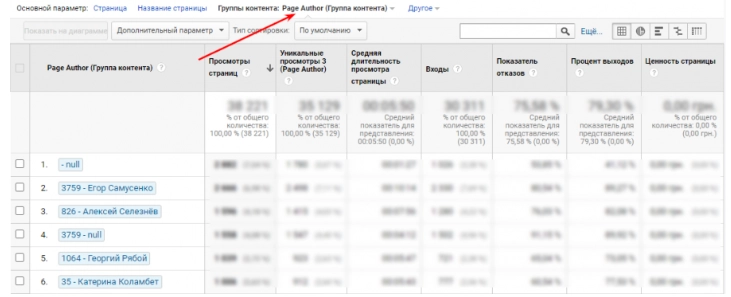
Content group
The parameters that are presented in this report will help you analyze in detail the headings available on your blog, individual pages, and even the material of certain authors, determine which of them are the most popular among readers, and which, on the contrary, have the lowest . Having this information, you will be able to make adjustments to the subsequent content strategy of your resource, and rely on specialists who provide the most interesting and informative material. If it turns out that some articles are not particularly popular, you can find similar material from your competitors, compare, find out the reasons for this phenomenon and make appropriate changes both to the article itself and to the plan for subsequent content. There is a possibility that the topic is simply so specific that there is no expert content on it. And this in itself has a negative impact on ranking.
You can find the report data in the Google Analytics “Behavior” block, then — “Site content”, followed by — "All pages". But we would like to draw your attention to the fact that this is not a completely standard report built into the interface of this service. This means that you will need to first enable it through the admin panel of your personal account and only then complete the basic settings for collecting data. We will now describe in detail how to do this:
- We set up data collection to generate a report. To do this, go to the “Administrator” tab. In the “Providing” block find the option “Content groups” and we go into it. Here we need to add a new group. To do this, click on the red button in the upper left corner of the active window with the inscription “+ Content group.”
- Now you need to configure the grouping. There are 3 options here: by tracking code, with extraction, based on rules. You choose which option for tracking the pages you are interested in will be most convenient for you and select the appropriate parameters. A good result is obtained by using an option such as “Grouping by tracking code”. In this case, it will be possible to track pages that have no connection with each other. If you choose this option, then continue with the settings.
- Go to the “Grouping by tracking code” block and here we click on the button with the “+” sign. directly next to the “Include tracking code” field.
- Come up with a name for your first content group. There are no specific recommendations here, the main thing is that you clearly understand what kind of material will be presented in this group and can easily find it in the future.
- Move the slider from the “Off” position to in "On" next to the “Enable” option. Below, select the numeric index of your content group. In total, you can configure 5 of them, that is, accordingly, the number will be from 1 to 5. But since we are now working with the first group, we select the number 1. Now all that remains is to simply click on the “Done” button so that all the settings you have made are saved.< /li>
This completes the setup. After this, within the next 24 hours, all the data you need will appear in Google Analytics, that is, it will become available to you as the main parameter in reports. The report itself will be provided in the form of a table containing the following parameters:
- 1 column — this is the numeric index of your content group that you specified earlier when making settings;
- 2nd column — this is directly the name of your content group, which you also specified;
- 3rd column — this is a Description indicating which option you have chosen to track pages of interest;
- 4th column — Last changes, that is, the date when these same changes were made;
- 5th column — Status: it can be either enabled or disabled and indicates whether information is being collected for a specific group at a given time or not.
The following settings in this report are performed in GTM and are aimed at ensuring that all the parameters that you have configured are read from the site. To do this we need to perform the following steps:
- Go to the Universal Analytics tag (you have already created it earlier). It will be used to transfer data from GTM to GA. Here we go to the “Variable Configuration” block.
- Go to the “Additional settings” tab, and in it select the “Content group” option. Click on the “+Content Group” button. After this, a window will open in front of you in which you need to make the appropriate settings. Here you enter the content group index from Google Analytics and the page variable as you did earlier. That is, we select exactly the option that you would like to track.
- Click on the “Save” button and publish the report. After this, a table with the data you need will open in front of you. It will look like this.

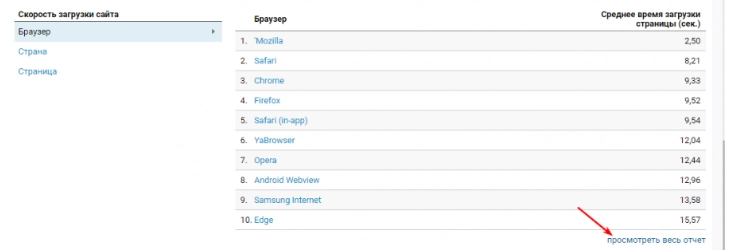
Site loading speed
Those days when users were ready to sit patiently and wait for the page they needed to load are already a thing of the past. Even a few seconds of waiting today will lead to the fact that a person will simply switch from your resource to some other — one that will load much faster. And here literally split seconds will play a key role. Today, the normal site loading speed is 2-3 seconds. Google Analytics has a number of reports that will allow you to determine the operating parameters of your resource depending on:
- region;
- browser;
- a single page.
You can get this information in the form of a graph, which will show the history of changes in the loading speed of your site. On it you can clearly see the moment at which problems with your resource began.
You can find this report in the “Behavior” block in Google Analytics, and then — “Site speed”, and then — "Review".
Click on the “View entire report” button to see more detailed information on each type of report.
We would like to remind you that you can also check Internet speed completely free of charge, because often there may be a problem with the speed of loading the site problems on the network provider side.
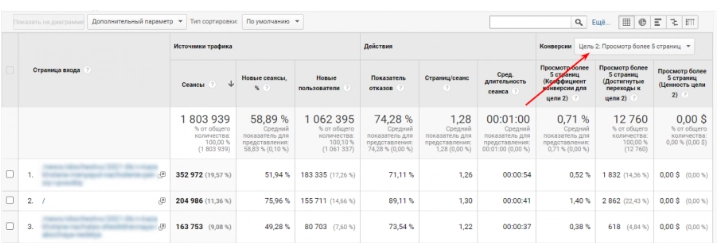
Login pages
Using this report will allow you to analyze the most popular pages of your site, as well as find publications that bring virtually no traffic, those that have a high bounce rate and, accordingly, make adjustments and changes to them. When you combine it with Google Analytics goals, you can significantly increase the value for yourself. That is, you will be able to see those pages where conversion actions were performed, you will understand which of the publications work better than others, and which, on the contrary, require a number of improvements.
This report is located in the “Behavior” block, then “Site Content” and already here “Login Pages”. To make the appropriate settings, you just need to select from the drop-down list in the “Category” block. the type of conversion you need. This block is located in the upper right corner of the report.
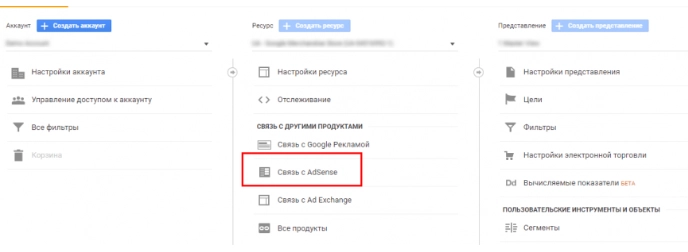
Publishers
This is not a single report, but a whole group that includes 3 key parameters for any specialist who monetizes his blog using the AdSense advertising network. We are talking about the following parameters:
- Review. Here you will find complete information on income received directly from the blog.
- Publishers: Pages. Individual pages and the income coming from them, in particular from displaying advertising, will be presented here.
- Publishers: URL transitions. Contains a list of domains from which the largest flow of user audience was noted.
That is, these are all the parameters that help determine the profitability of a blog.
You can find it in the “Behavior” section, and then directly “Publishers”. There is nothing complicated about the settings here. The only thing – You will need to initially link your analytics resource to your AdSense account. This can be done through the “Administrator” tab. In it, already select the “Link with AdSense” option.
To summarize
If you specialize in promoting sites and resources, if you want to keep this process under full control, then you should definitely use Google Analytics in your work, in particular those reports that we talked about above. This is:
- Cohort analysis. This is what will allow you to determine the number of users who returned to your site after their first visit, as well as how effectively remarketing tools work.
- Comparison of channels. Allows you to analyze the main indicators of the site by comparing them with a certain average parameter taken as a control.
- Location. With its help, you can determine in which countries and regions your blog is in high demand.
- User statistics. This report will be useful so that you can literally study the customer's journey step by step, from his very first visit to your blog until the end of the session.
- Content groups. They allow you to identify the most interesting material, as well as direct articles, individual sections, and the best blog authors.
- Site loading speed. Shows how quickly your pages load and, accordingly, how long users have to wait.
- Login pages. Designed to show the most popular and least popular resource pages, thereby providing opportunities for making adjustments to improve performance.
- Publishers. They allow you to determine what material benefits certain pages bring. That is, what kind of income comes from the blog, including from advertising impressions. Find the domains from which the largest number of visitors come.
Everyone who specializes in promoting and blogging, and working on the site as a whole, should control all these, as well as a number of other operating parameters. This is the only way you can be aware of the current situation, understand which of your actions gave a positive result, and which, on the contrary, leave much to be desired. Thanks to timely reactions and changes, you can significantly increase the efficiency of your actions and, accordingly, the material benefits from blogging.
But here you should also understand that you are unlikely to be able to work with all these services without risks and any restrictions. There is a high probability that your actions will not be received particularly positively by the system, which may ultimately lead to account blocking, access restriction, and more. Also, do not forget that everyone who works on the Internet today risks losing their personal data, as well as other important information, and coming under attack from hackers.
Connecting to the work of mobile proxies from the MobileProxy.Space service will help prevent all these negative consequences, as well as ensure the most stable functional operation on the network without any risks and restrictions. In this case, you get a reliable intermediary server that will pass through all incoming and outgoing flows, ensuring that user data is replaced with its technical parameters and vice versa. Thanks to this, your connection to the Internet and all work performed will be as secure and confidential as possible. At the same time, high operating speed is maintained. In some cases, it will be even higher due to the ability to cache data. You will also have a huge number of addresses at your disposal, which you can change either by force using a link from your personal account or by setting a timer for automatic change in the interval from 2 minutes to 1 hour. There is also a huge number of geolocations from different countries in the region of the world: choose the appropriate option to bypass their regional restrictions and collect statistics for the location you need.
We suggest taking advantage of a free two-hour test to verify the effectiveness of mobile proxies before purchasing them. You can learn more about all the nuances of using and paying for mobile proxies here. If you have any additional questions or technical difficulties later in your practice, please contact our support service, which is available 24 hours a day, 7 days a week.