Latency Map: Free Proxy Latency Map for Popular Websites and How to Get the Most Out of It
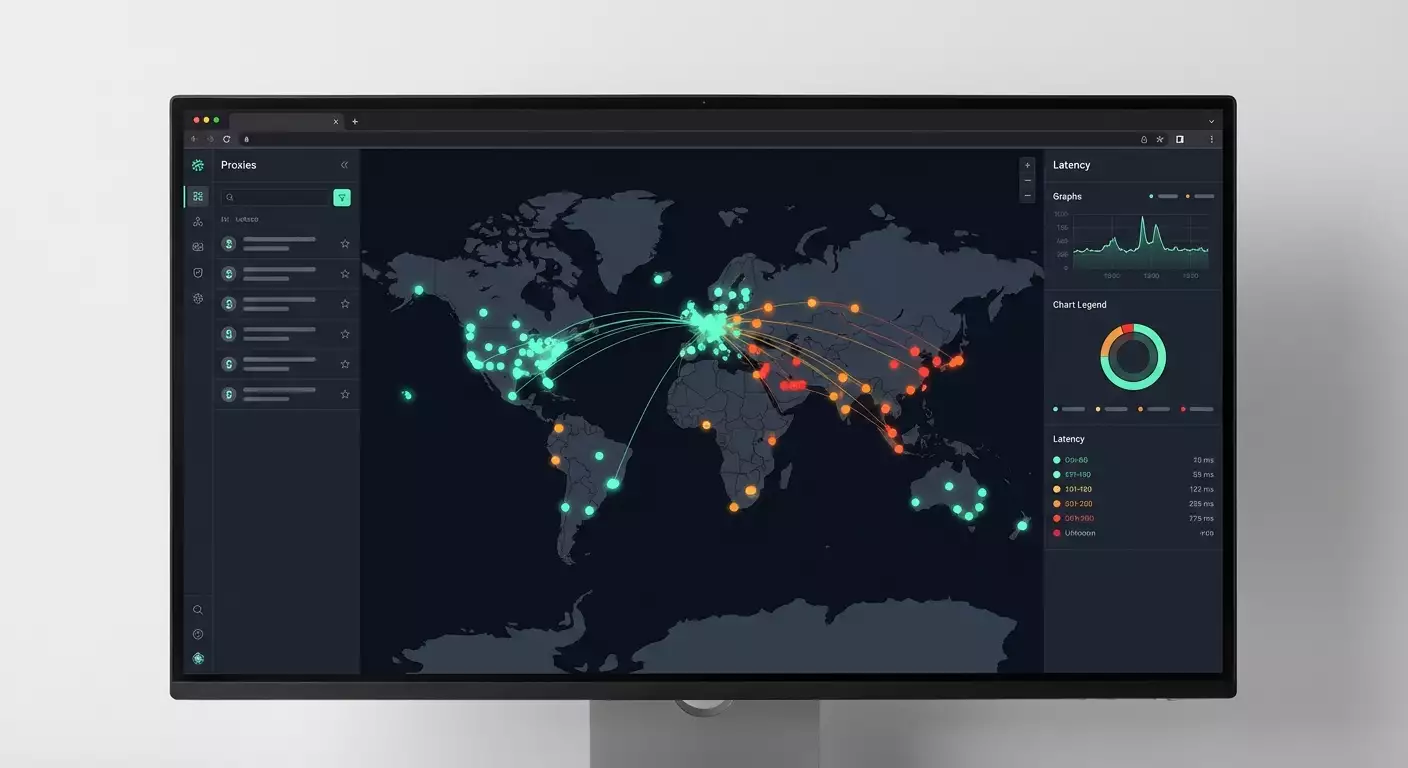
Table of contents
- Introduction: why proxy response speed matters and where we lose money
- Latency map service overview: key features and benefits
- Scenario 1. marketing and media buying: choosing proxies for ad platforms
- Scenario 2. seo, scraping, and data collection: faster results with fewer captchas
- Scenario 3. e-commerce and retail: price monitoring without timeouts
- Scenario 4. qa, product, and localization: checking real ux from different countries
- Scenario 5. support and sre: “hot” diagnosis of complaints within minutes
- Scenario 6. risk management and compliance: network profile forecasting
- Scenario 7. proxy purchasing and cost optimization: avoid overpaying
- Comparing with alternatives: why latency map is more convenient
- Faq: frequently asked questions about latency map
- Conclusions: who should use it and how to get started right now
Introduction: Why Proxy Response Speed Matters and Where We Lose Money
We’ve all faced situations where it seems everything is set up perfectly, yet the system still lags. Scraping jobs and reports get interrupted. Advertising dashboards slow down and log us out. Marketplaces respond sluggishly, and the retry logic in scripts is off the charts. The culprit? Network latency between your proxy and the target website. A fast server doesn’t mean much if the route to the target resource is long, causing packets to take a convoluted path across the globe. In 2026, as anti-bot systems increasingly check behavioral and network signals, and HTTP/3 and QUIC change routing dynamics, latency metrics become especially sensitive to geography, protocol selection, and the quality of your proxy provider.
The challenge we address is to quickly, en masse, and visually evaluate the latency from specific proxies to popular websites, compare results across geographies, and make practical decisions — how many proxies to acquire, how to redistribute loads, where to change locations, and where it’s sufficient to adjust timeouts and retries.
The free online tool Latency Map from mobileproxy.space meets this need: you upload a list of proxies, select websites, run a test, and see everything on an interactive map. Instantly, without installations, complex scripts, or manual measurements of “ping” per single address. Importantly, the service measures real network latency at the HTTP(S) or TCP level to the target domain (not ICMP ping), which is closer to the practical experience of your application or browser.
Latency Map Service Overview: Key Features and Benefits
What it is: A free tool for evaluating the latency of proxies to popular websites visualized on a world map. Accessible in the browser on the Latency Map page (part of the mobileproxy.space website). No registration or payment required, with a focus on practical testing.
How It Works
- You specify a list of proxies in host:port format, and if needed, username and password. Common authorization schemes and recording formats are supported.
- You select one or several popular websites for testing. The list includes standard resources: search engines, social networks, marketplaces, CDNs, and media.
- You run the test and observe the interactive map with points, color-coded latency, and summarized statistics for each site and proxy.
Benefits to Note
- Quick Start. No installations or dependencies. The tool works in the browser and is ready for bulk checks.
- Realistic Measurements. The latency of the connection to the target site is measured using the actual protocol, rather than the abstract ICMP ping, which is often blocked.
- Map. You can immediately visualize the geography and patterns: where stable low latencies are and where there are network drops or unexpected routes.
- Website Comparison. Compare proxies across multiple targets. This helps identify providers that optimally align with specific platforms.
- Free of Charge. For quick and regular checks, this is a crucial argument. You can run it every day if needed.
Technical Considerations
- Measurement Method. In 2026, many sites route traffic through CDNs and Anycast. Real latency depends on the nearest point of presence, as well as the TLS handshake, protocol, and firewall policies. The Latency Map accounts for this at the application level.
- Geo-to-Site Effects. For some sites, proxies from Warsaw and Prague show 20-40 ms, while for others, it can range from 80-120 ms. This is normal: routing and CDN policies vary.
- Stability vs. Spikes. A single measurement is merely a snapshot. It’s better to conduct multiple runs and look at the median and distribution to filter out short-term spikes.
Scenario 1. Marketing and Media Buying: Choosing Proxies for Ad Platforms
Who It’s For: Media buyers, performance marketers, agencies managing ad accounts across different geographies.
Purpose: To reduce the likelihood of timeouts and unnecessary dashboard reloads, accelerate navigation, and load creatives while minimizing stress on anti-bot checks through a stable network profile.
How to Use It
- Prepare 50-200 proxies from target locations: country and, if possible, nearby cities relative to the desired platform.
- Upload the list to Latency Map, marking ad ecosystem websites and related domains (e.g., analytics resources and static files).
- Run the test. Record latency for each proxy across key targets.
- Create a shortlist of the top 20-30% based on median latency and stability (consider both the minimum and predictability).
- Assign these proxies to active profiles and monitor their behavior over a week.
Example of Results
A team from Eastern Europe tested 120 proxies across four ad ecosystem domains. Initially, the average latency was 230-280 ms with occasional spikes up to 600 ms. After selecting the top 30% based on median and stability, the median dropped to 110-140 ms, spikes were reduced by 3.2 times, and the share of timeouts when loading dashboard interfaces decreased by 27% during peak hours.
Life Hacks
- Don’t Chase Absolute Minimums. Stable latencies of 120-140 ms are better than 70 ms with spikes reaching 900 ms.
- Check Related Domains. Ad platforms often pull content from auxiliary hosts. The weak link may be non-obvious.
- Separate Assignments. Different dashboards require different proxies, even if the geographies are the same. This reduces competition for resources and spikes.
Common Mistakes
- Testing only the “main” domain while ignoring auxiliary ones where the delays occur.
- Evaluating based on a single run. Perform 2-3 runs and look at the median.
- Mixing proxies with different authorizations and protocols in one pool without labeling, leading to chaos in diagnostics.
Scenario 2. SEO, Scraping, and Data Collection: Faster Results with Fewer CAPTCHAs
Who It’s For: SEO specialists, scraper developers, competitive intelligence teams.
Purpose: To choose proxies that offer minimal latency to search engines and target websites to enhance pass-through speed, reduce retry rates, and limit anti-bot trigger chances.
Algorithm
- Gather a pool of 200-500 proxies, categorizing them by regions (e.g., EU, US East, US West, APAC).
- In Latency Map, mark key search and target domains (search engines, mirrors, CDN of target sites).
- Run 2-3 rounds of tests with 10-15 minute intervals and gather median values.
- Cluster proxies into groups: fast, medium, slow. Assign fast ones to hot tasks, medium ones to less sensitive tasks, and slow ones to background indexing.
- Sync this with your scraper configuration: channels on proxies, time limits, and retry rules.
Practical Case
A news feed scraper operated in 12 streams on 300 proxies. The average page load speed was 2.3 seconds, with a retry rate of 9.7%. After clustering based on Latency Map results and reassigning fast proxies to hot domains, the speed dropped to 1.6 seconds, retries decreased to 4.1%, and the overall daily volume of collected documents increased by 38% with the same resources.
Best Practices
- Focus on Distribution, Not Just Averages. Latency “tails” can kill your scraper's SLA.
- Combine with Local Tests. It’s advisable to cross-check with curl -x results and time-to-first-byte on a typical GET.
- Leave a Buffer. The pool should have 15-25% reserve of fast proxies for spikes or bans.
Common Mistakes to Avoid
- Choosing rotating proxies for tasks that need stable cookies and sessions. For stability, use “sticky” sessions.
- Lacking regional labeling. Without it, understanding where latency bottlenecks occur is difficult.
Scenario 3. E-commerce and Retail: Price Monitoring Without Timeouts
Who It’s For: E-commerce analysts, pricing specialists, competitive monitoring teams.
Purpose: To reduce timeouts when crawling product cards and filters, align data extraction speeds, and shorten price freshness windows.
Implementation Steps
- Gather a pool of proxies from key markets: where your competitors' warehouses and customers are located. This is crucial for price and assortment relevance.
- In Latency Map, mark target marketplaces and static domains (images, CDNs) that significantly affect total load time.
- Conduct three runs at different times of day, obtain the median and interquartile range.
- Select the top 40% for stability and average latency and allocate them to critical countries.
- Assign the rest to background tasks and less frequent categories.
Results in Practice
A team monitoring 9 marketplaces across 5 regions reduced the average catalog pass time from 3.1 to 2.0 seconds and decreased the share of pages with timeouts from 6.2% to 2.3%. Consequently, the “price currency” window shrank from 45 to 28 minutes with the same server fleet. During seasonal peaks, update lag on critical SKUs dropped to 12-15 minutes through automatic reallocation to the fastest proxies.
Recommendations
- Separate Streams by Domains. Don’t assign different heavy marketplaces to one proxy simultaneously. Have fast proxies “locked” to one or two key domains.
- Monitor “Static Content.” Even if the HTML loads quickly, static resources via another CDN can slow down and indirectly affect your parser/render timings.
- Seasonality. During sales and holidays, conduct additional Latency Map runs and retrain the distribution every 12-24 hours.
Scenario 4. QA, Product, and Localization: Checking Real UX from Different Countries
Who It’s For: QA engineers, product managers, localization teams, content managers.
Purpose: To ensure that users from target regions receive a swift response from resources, especially if you’re using CDNs, geo-redirects, and content personalization.
Action Steps
- Prepare a list of proxies close to your target cities. If you’re active in Madrid, opt for not just “Spain,” but specifically Madrid/Valencia/Barcelona.
- In Latency Map, test latency to your domain, CDN domain, and external services that affect UI (fonts, analytics, widgets).
- Compare latencies between regions and providers. Pay attention to countries with anomalous values.
- Pass the results to SRE/DevOps for verification of routing, caching adjustments on the CDN, and TLS policy.
- Restart the test after changes, comparing with the previous median and tails.
Case Study
The product team noticed complaints from Brazil: pages felt “heavy,” and logouts increased. The Latency Map test showed 350-420 ms to the main domain and up to 700 ms to the static CDN. After reconfiguring the CDN to the nearest PoPs and optimizing TLS policies, the median dropped to 150-190 ms, authorization failures returned to normal, and NPS for the region increased by 0.6 points within two weeks.
Life Hacks
- Check External Tags. Counters, widgets, fonts — common sources of network “stickiness.” Their median in the region should be no worse than that of your main domain.
- Combine with Synthetic Tests. Compare Latency Map with standalone measurements for TTFB, LCP, and INP in browser automation.
- Plan A/B Changes. Test network changes in one region and verify the Latency Map effect before a global release.
Scenario 5. Support and SRE: “Hot” Diagnosis of Complaints Within Minutes
Who It’s For: Support teams, SRE, on-call engineers.
Purpose: Quickly confirm or refute a network hypothesis regarding user complaints from a specific region and determine where to escalate—whether to the CDN, proxy provider, or internal services.
Action Protocol
- Received complaints from a specific region or country. Open Latency Map.
- Upload a set of “reference” proxies from that country. If you don’t have your own, use verified public or rented ones.
- Conduct a test to your key domains. Compare with the baseline median saved from previous runs.
- If latency increase is confirmed only on static content—escalate to the CDN. If across everything—check routing and potential blocks.
- Create an incident with a screenshot of the map and a tabular summary of median, peaks, and timeout percentage.
Example
An on-call engineer received overnight alerts about increased response times from Singapore. The Latency Map showed 2-3 times increased latency solely to the static domain. After inspecting nearby PoPs on the CDN side, the issue was localized and resolved in 25 minutes. MTTR was cut almost in half compared to the average.
Best Practices
- Keep Snapshots. Record median and tails for reference geos. This is your benchmark for incidents.
- Segment Domains. Conduct separate tests for APIs, static files, authentication, third-party services.
- Maintain a “First Aid Kit.” Keep a list of verified proxies from critical countries handy to save time during incidents.
Scenario 6. Risk Management and Compliance: Network Profile Forecasting
Who It’s For: Risk managers, compliance officers, engineers responsible for accurate geo-tagging and user scenarios regarding location.
Purpose: To ensure network parameters do not create false alerts: for example, the probability of an “atypical” profile due to excessive latency between declared geo and target resources.
Plan
- Select proxies from countries where correct locale and regulations are crucial.
- Measure latency to basic sites in the region: local search engines, news portals, payment gateways, government services (if publicly available and don’t prohibit such checks).
- Create a profile of acceptable latency ranges for each country and city: median, IQR, rare peaks.
- Compare new proxies against the benchmark. Suspect excessively high latencies—double-check real geolocation and routing.
Practical Effect
The team reduced the share of false flags for “atypical behavior” by 18% by shifting user agents to proxies that exhibited a network profile close to the regional reference. At the same time, operational failures for compliance decreased by 11% without compromising security.
Remarks
- Ethics and Laws. Use proxies strictly within the law, the terms of websites, and your company’s policies. The tool addresses measurement tasks, not bypassing restrictions.
- Cross-Check ASN and Cities. High latency to local resources is often a sign of a mismatch in actual geo.
Scenario 7. Proxy Purchasing and Cost Optimization: Avoid Overpaying
Who It’s For: Proxy buyers, team leads responsible for budget and SLA.
Purpose: To compare providers, choose optimal locations and address pools, exclude “red” networks, and organize a procurement plan.
Step-by-Step
- Gather a test list from 3-5 providers in the same countries.
- Run sequential tests in Latency Map on identical sets of target websites, saving the results.
- Compare median, stability, and timeout rates for each provider and country.
- Create a matrix of “price — median — stability” and calculate the cost per millisecond for critical directions.
- Purchase a core pool from the provider with the best balance of price and stability, retaining a reserve from an alternative pool.
Conclusion
The team reduced expenses by 14% over a quarter, moving away from a premium provider in two countries where Latency Map metrics showed parity with a more affordable player. Meanwhile, the SLA on latency remained in the green zone, and timeouts even fell by 0.9 percentage points due to the rejection of specific subnets with anomalous tails.
Buyer's Tips
- Test in Batches. It's essential that different providers are tested at similar times and on the same domains.
- Observe the Tails. If the 95th percentile diverges significantly, real task performance will falter during spikes.
- Don't Forget About IPv6. By 2026 more resources are optimizing traffic for IPv6. Compare results between v4 and v6 if your streams support it.
Comparing with Alternatives: Why Latency Map is More Convenient
Scripts and Utilities
Classic approaches: ping, curl -x, custom Python scripts. Advantages: flexibility and control. Disadvantages: require development time, infrastructure for visualization and metric storage, and can be complicated for non-engineers. Latency Map solves 80% of the tasks out of the box, shows a map, and doesn’t require coding.
Commercial Monitoring Platforms
Advantages: rich reports, alerts, historical trends. Disadvantages: paid services, setup takes time, not always tailored specifically for proxies or bulk point checks for specific sites. Latency Map is a free rapid response tool: where exactly does it lag with these specific sites and proxies.
ICMP Ping and Tracing
Useful for network diagnostics, but often blocked and do not reflect HTTPS behavior. Latency Map measures latency at the application level, closer to what the user or your script experiences.
Conclusion
If you need immediate and clear data, Latency Map excels: interactive map, bulk proxy uploads, comparison of multiple sites without coding and costs. For long-term monitoring, you can combine the tool with your metric and logging systems.
FAQ: Frequently Asked Questions About Latency Map
1. What exactly does the service measure — is it ping?
No, it’s not ICMP ping. The tool focuses on the application layer: measuring the latency of establishing a connection and receiving a response from the target website using the actual protocol. This is closer to what a browser or your parser experiences.
2. Are HTTP and SOCKS supported?
Standard proxy formats with and without authorization are supported. For most cases, HTTP(S) and SOCKS work out of the box. Confirm the protocol with your proxy provider and use the correct recording format.
3. Why is latency to different websites so varied from the same proxy?
Due to CDN, Anycast, caching policies, and routing. Different sites may be served from different PoPs. This is a normal scenario in 2026.
4. Can I test many proxies at once?
Yes, the tool supports bulk uploads. For accurate results, conduct multiple runs and observe timeout limits.
5. What do the colors on the map represent?
The color scale reflects ranges of latency: generally green — low, yellow — medium, red — high. Specific thresholds depend on the scale selected in the interface and may be adjusted.
6. Where are the results saved?
You use the tool in your browser. It’s recommended to export or record results after runs for further analysis. Internal storage mechanisms may change, so rely on the current functionality of the Latency Map page.
7. How to test rotating proxies?
Run several trials on the same host to capture distribution. If necessary, use “sticky” sessions if your provider supports them to assess stability.
8. Why are there timeouts or zeros on some sites?
The site may have limited request frequency, blocked a specific outgoing IP, or used specific policies that do not allow completing the measurement correctly. Repeat the test, check the proxy format and authorization, and compare with an alternative proxy.
9. Does this work with IPv6 and HTTP/3?
In 2026, many sites are transitioning to IPv6 and HTTP/3. Results may vary by protocol. If your proxy provider and target site support IPv6, compare metrics for v4 and v6. Regarding HTTP/3, consider QUIC features and CDN behavior.
10. Can I test my internal domains?
If the domains are accessible from the internet via your proxies, yes. For internal networks without external access, measurement will not be possible.
Conclusions: Who Should Use It and How to Get Started Right Now
Who Needs It: Marketers and media buyers, SEO and scraping teams, e-commerce analysts, QA and product teams, SRE and support staff, proxy buyers. Everyone who makes decisions where every millisecond impacts stability, SLA, and conversions.
What You Get: A real picture of latency between your proxies and actual sites, an interactive map for clarity, quick selection of the best addresses, and control over stability. The tool is free and works in the browser, saving you time and budget on diagnostics.
How to Start:
- Gather a list of proxies by target countries and cities. Note the protocol and authorization.
- Open the Latency Map page on the mobileproxy.space website in the latency-map section.
- Upload proxies, mark the sites you need, and run the test.
- Conduct 2-3 runs, save the median and distribution. Form a shortlist of the best proxies for critical tasks.
- Integrate the tool into your configurations, revisit limits, retries, and load distribution. Repeat tests every 1-2 weeks or before traffic peaks.
And finally: Use Latency Map in conjunction with your performance analytics and logging. Where immediate clarity and bulk testing are needed, the proxy latency map is a fast, free, and understandable tool that helps make data-driven decisions rather than relying on gut feelings.