DevTools: TOP tools for developers and marketers

Table of contents
- How to call devtools through the browser
- Adjusting the position of the element on the page and its overall design
- Checking how responsive your site is
- Running xpath queries
- Take screenshots in high quality
- Checking how correctly the site code loads
- Checking how quickly the site loads
- Determining the content of the site
- Checking the load on the user's computer
- Download multimedia content
- Clearing cache and storage
- Determining the weight of the site
- Verifying certificates
- Checking the site’s responsiveness to user requests
- Analyzing the stability of the site
- Checking site speed by users
- To summarize
In the process of optimizing, creating, testing Internet sites or individual applications, developers use a fairly impressive set of tools. So, there is a fairly impressive set of solutions that are built into browsers today – DevTools. Thus, the modern IT technology market offers many solutions that allow you to take screenshots, measure site loading speed, check the adaptability of a resource, that is, how it is displayed on different devices and more. Most of these tools can rightfully be called universal, that is, those that are useful not only for developers, but also for other specialists.
In particular, we will now dwell in more detail on what solutions may also be useful for Internet marketers in their daily work. We will present the most common and popular tools, and also tell you how to use them in order to obtain the most correct data with minimal waste of time and effort. We will also tell you where to buy reliable mobile proxies that will do the work of a modern marketer, targetologist, developer, tester and many other specialists in the most functional, fast, stable way possible, will help you avoid various risks and restrictions.
How to call DevTools through the browser
Most of all the tools that both developers and marketers may need in their workflow are already built into the browser. In particular, today in DevTools you can find in search engines such as Google Chrome, Mozilla Firefox, Opera, Yandex Browser. But you won’t be able to see them right away, since they are hidden. To run them, use one of the following solutions:
- Pressing three buttons “Ctrl + Shift + I” at the same time.
- Click the right mouse button on the desired page. In this case, you should select the “View code” option. We would like to draw your attention to the fact that you are interested in “View code”, and not an option such as “View page code”, which will be located in the same block.
- Through the browser menu. So, if you are working through Google Chrome, then you will need to click on the 3 vertical dots in the upper right corner of the working window. Next, from the drop-down menu, select the “Additional tools” option, and here — "Developer tools". We would like to note that in other browsers the actual call to the menu itself will be different, while the developer tools are launched according to the same principle.
Our entire subsequent review will be based on working with DevTools in the Google Chrome browser. So, today there are 11 tabs: “Elements”, “Network”, “Sources”, “Memory”, “Performance”, “Security”, “Application”, “Recorder” , « ;Lighthouse", "Performance insights". And each of them contains tools that may be of interest not only to developers, but also to marketers directly.
We will now dwell on the most popular and sought-after solutions in more detail.
Adjusting the position of the element on the page and its overall design
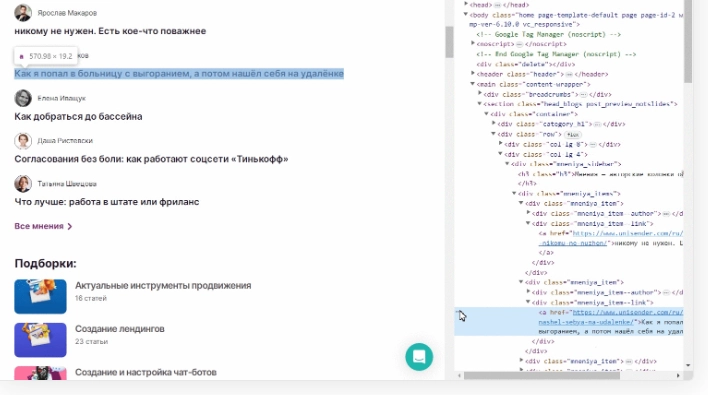
These settings can be made through the “Elements” tab. Both the HTML code of the page and its CSS code will be displayed here. All data presented here will be relevant for the page of your site that is open on your screen at a given time. At this stage, you will have the opportunity to make adjustments not only to the HTML and CSS files, but also to JavaScript.
First you need to select the code that you want to change. To do this, click on the cursor icon located in the upper left corner of the DevTools window. A more convenient solution that allows you to call this window — press the button combination “Ctrl + Shift + C” at the same time.
Now you have the opportunity to use the mouse to move between one or another content of the page. It is enough to bring it to the line you need, so that in the open source editor, which will be located in the same window, the highlighting directly highlights the code of this line.
If you need to make any adjustments, you need to initially select this element by double-clicking on it with the left mouse button. This will cause the line in the editor nearby to be frozen. To make the necessary changes to it, click on the icon with the image of 3 dots at the beginning of this very line and select the “Edit as HTML” option from the drop-down list. This is what will allow you to make changes to the HTML code. At this stage you will be able to:
- delete this or that text;
- write your text;
- change the relative position of individual elements;
- change existing markup.
Moreover, right here you will have the opportunity to see what changes your actions have led to. To do this, simply left-click on any empty space on the screen. This is enough for the site to update and you to see the adjustments made. If you decide to experiment with the relative position of elements, then you just need to select its code and drag it up or down, thereby changing the position in the HTML in relation to other elements.
In the same way, you can make adjustments to the CSS code. But all the necessary tools for this are presented in the “Styles” tab. You can find it at the bottom of the active window. To change the style, you will also need to select the appropriate element in the HTML editor. It will open on its own in the “Styles” section. Here you can change not only the color palette, but also the font type, its size, add bold, italics and make a number of other adjustments that are directly related to style.
Before saving any changes, you can try out an unlimited number of designs. Check how harmonious this or that option will look. This way, with minimal waste of time and effort, you can choose the design for your website or application that, in your opinion, will look the most harmonious, stylish, and presentable.
Checking how responsive your site is
This is necessary in order to see how correctly an Internet resource or a separate application will be displayed on different devices, such as a personal computer, laptop, tablet, or smartphone. To perform these steps, you need to initially launch DevTools. Pay attention to the upper left corner of the active window. There will be 2 buttons side by side: one with an image of a computer mouse, and the other — laptop and smartphone. The last icon is used to check adaptability.
To perform the work itself, click on it. Immediately after this, a new panel will appear at the top of the active window. Here we choose which display mode we are currently interested in: from a computer or from a smartphone. Moreover, you will also have the opportunity to choose the appropriate orientation of the smartphone and its model. After this, the site or application will immediately appear on the screen in front of you in the format in which you would see it on the screen of your phone.
You can move between different models to see if there are differences or if any adjustments are needed. We perform similar actions with a laptop.
Today, there are other ways to check the adaptability of a website or application, but we have presented one of the simplest and easiest-to-use solutions that requires minimal settings and allows you to get results literally in real time.
Running XPath queries
Using the DevTools developer tools, you can send XPath queries to absolutely any element located on the page of your site. In this case, the work is performed through the “Elements” tab. Go into it, click on the code element that you need at a given time. Just right-click on it to copy it for yourself. That is, after clicking the mouse, first select the “Copy” option from the drop-down list. and behind her is already — "Copy XPath".
But how can you use the information received? For example, include it in the data parsing settings in order to collect the necessary semantics and analyze the content available on the site from the point of view of its usefulness for SEO optimization of the resource.
DevTools also allow you to test XPath for certain errors. To start the check, you need to click on the button combination “Ctrl + F4”. In the window that appears, enter the appropriate request. The system will automatically highlight all these elements that correspond to it. If it turns out that DevTools does not display anything for you, then there was an error in the XPath expression.
Take screenshots in high quality
Surely in your work as a developer, tester or marketer, you have repeatedly encountered the need to take screenshots. But despite the fact that today there is a huge variety of specialized tools on the market, not all of them allow you to take high-quality images. DevTools is ready to offer you such a solution. So, with its help you can take screenshots of a website or application in fairly good quality.
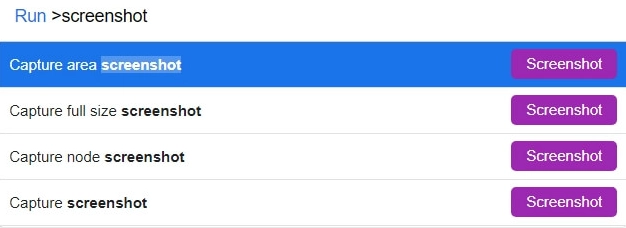
To use this solution, you need to go to the developer tools by calling the corresponding menu by simultaneously pressing the “Ctrl+Shift+P” buttons. In the search window that opens, enter the query “screenshot” and from all the proposed options, we choose the one that will be most convenient for you. The following solutions are possible:
- «Capture full size screenshot». With this tool you can take a snapshot of the entire page. Both the active window and all other areas, including the toolbar, that are open on the screen at a given time will be displayed here. Moreover, here the program will take a snapshot of even that part of the page that is not currently displayed on the display.
- «Capture area screenshot». Using this tool, you can take a snapshot of not the entire screen, but a separate part of it. That is, in this case, after clicking on the corresponding button, you will need to use the mouse to select the area of the active window that you would like to photograph. As soon as the mouse button is released, the screenshot will be ready.
- «Capture screenshot». Using this tool, you can take a snapshot of only that part of the screen that is currently displayed on your monitor.
- «Capture node screenshot». This tool will be useful if you want to take a picture of a single element, which you will first select in the “Elements” tab. The work here must begin somewhat from afar. Initially, you select the element you need, then call up the active menu by clicking on the “Ctrl + Shift + P” button combination, and only then enter the “screenshot” command. And only now do you choose directly “Capture node screenshot” from the proposed options.

Regardless of which screenshot option you select at a given time, all images are saved in PNG format.
Checking how correctly the site code loads
If you go to the “Console” tab, you can check how correctly the JavaScript is working, and also use your own code to test the page. Also, using this tool, you can see if there are any inaccuracies or failures in the loading of your chosen fonts, styles, or downloaded images. If DevTools detects any errors, the system will highlight them in red. This means that you can easily identify them. That is, you will only need to click on a particular error to see what problems the system has encountered, understand what exactly caused the incorrect operation and fix the problem.
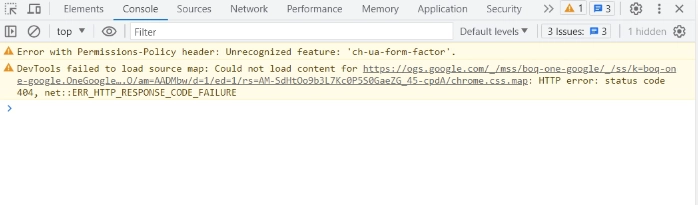
Let us remind you once again that in this case the site is checked through the “Console” panel.
Checking how quickly the site loads
In this case we are talking about such a DevTools tab as “Built-in proxy analyzer”. With its help, you can monitor the HTTP traffic of a page at the stage of its loading and already in working mode. Using this tool, you will be able to see all the requests that your resource sends. After analyzing the data received, you will be able to understand which of them do not serve a functional purpose for you, that is, you will be able to disable them. In turn, this will reduce site loading time and monitor how quickly and correctly other, more important requests are executed.
The tab itself is made in a tabular format, which makes it easier to read. So in one column the status of the request is displayed, that is, it is currently being executed or not. The second shows the number of requests coming from the site simultaneously. Another column displays the time during which certain data was loaded. Among other important information that can also be found in this table, it is worth highlighting the loading time of the program interface for XML and HTML code, that is, the DOM. This is the tool with which scripts are created. You can also track how quickly third-party resources that are directly involved in displaying your portal load.
The advantage of this solution is that in one tab you can control the loading speed of absolutely all elements that will be important in your work. For greater convenience, they can be divided into groups, for example, JavaScript code, images, CSS styles, fonts, etc.
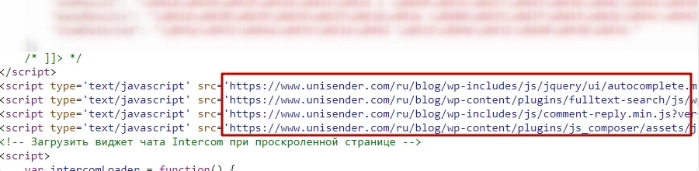
Determining the content of the site
Using DevTools, in particular through the “Sources” tab, you can see all the files that the site accesses in its work. These can be documents from any source. So, if you wish, you can see what CMS your resource is built on. Here it will be enough to pay attention to the abbreviation. In particular, the letters wp will indicate to you that the site is built on the WordPress platform.
That’s it for the “Sources” tab. don't end. Here you can also find out which pixels are currently set on your site. If you wish, you can replace them using phrases such as “GTM”, “Analytics”, “Pixel”. It will also be possible to study the existing file system, replacing the “Google Tag Manager”, “Google Analytics" and others like them.
Checking the load on the user's computer
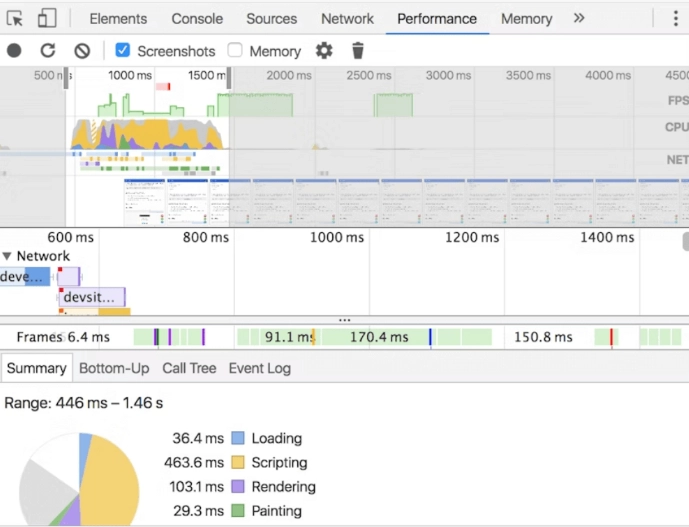
To ensure stable and reliable operation of your site, you must understand the load it places on the user’s device. And DevTools will allow you to do this. In particular, you need to go to the “Performance” tab. Here you will see information about how long the user needs to wait for a response from the server, how long it takes to render the interface. The system will also show after what period of time the user will see the loading of at least one of the elements of your resource.
Based on this information, you will be able to understand how quickly your site loads on the user’s computer and whether there is a need to make appropriate improvements and changes to make it more accessible and convenient for visitors.
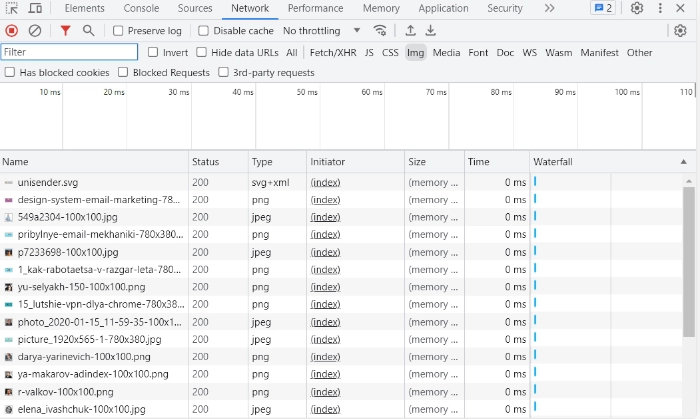
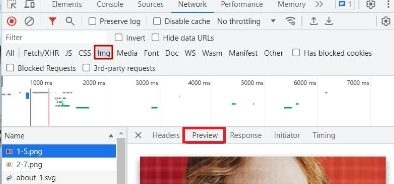
Download multimedia content
All solutions related to uploading pictures, photos, audio and videos can be found in the “Network” tab. To call this menu, you need to open the corresponding page and press the key combination “Ctrl + R”. After this, you will see an impressive list of all files. Then select those that are currently needed in your work. To optimize the search process, it provides the ability to sort by content format. So, if you are looking for an image, then you can set the “Img” filter, and if you are interested in video and audio, then, accordingly, select the “Media” format. If you do not want to open all files, use the "Preview" preview option.
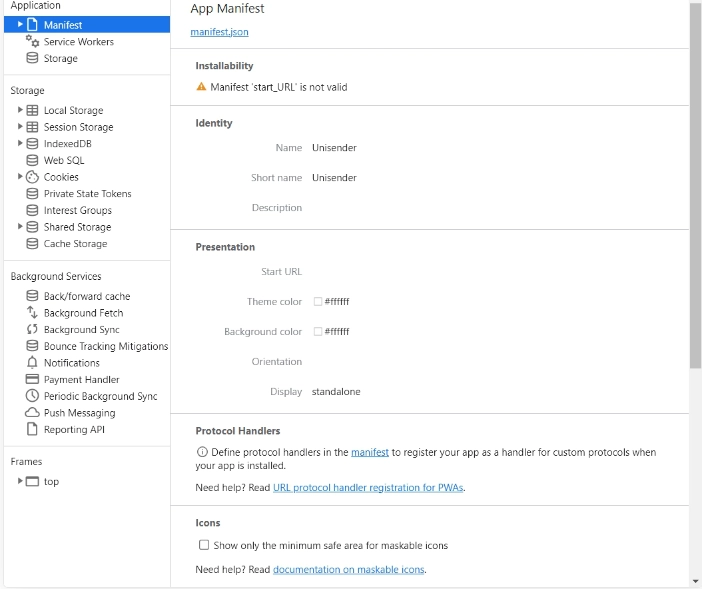
Clearing cache and storage
These are also very important aspects that will optimize the performance of your website and improve database management. This work is performed in the “Application” tab. in order to clear the cache, you need to go to the “section” here ;Storage. From the options presented, select “Clear site data”. You can also delete cookies easily and simply. To do this, simply check the appropriate box next to “including third-party cookies.”
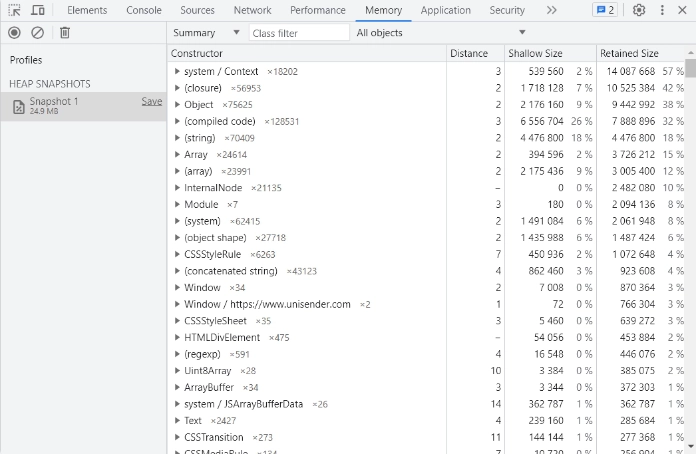
Determining the weight of the site
This is also one of the important parameters that will allow you to understand how much your resource loads the user device. If this indicator is too high, you will need to look for ways to optimize, because the portal will be inconvenient to use for visitors. That is, the excessive weight of the site — this is one of the reasons that people will look for an alternative to it.
You can perform this work through the “Memory” tab. Here are tools that will allow you to monitor your JavaScript code. That is, how this code loads the user device, how much memory it consumes. When you identify a problem, look for ways to fix it.
Verifying certificates
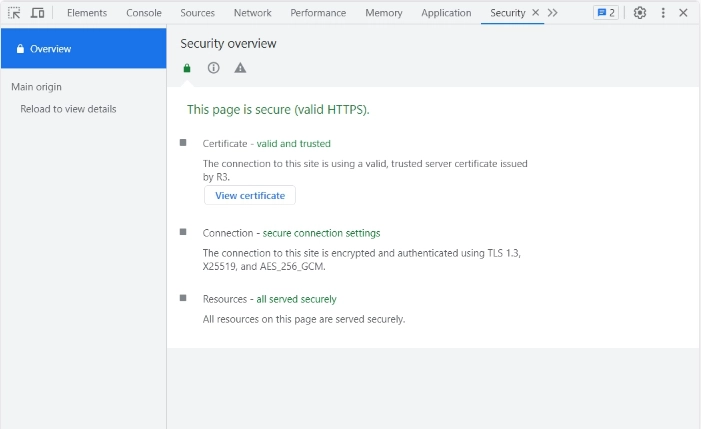
In order for your website to work as stable as possible and not cause any complaints from the system or users, you need to periodically check the current certificates of your resource, as well as how secure your connection is.
To do this, go to the “Security” tab. The results of automatic verification of both certificates and connection security, as well as all connected resources, will be displayed here. From the information provided, you will be able to see those requests that are not currently protected for you.
Checking the site’s responsiveness to user requests
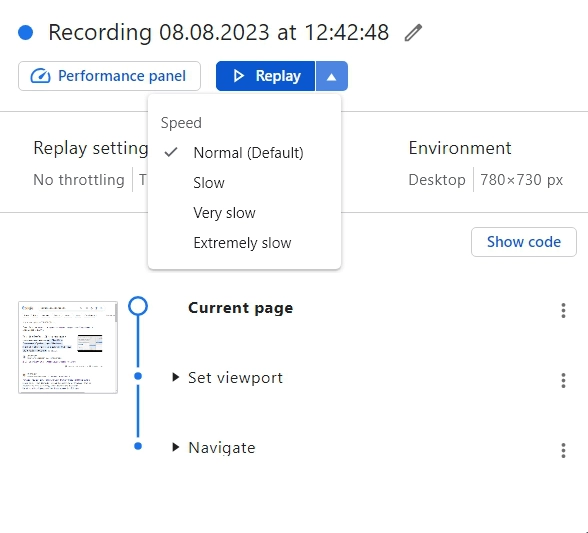
To perform these works, you need to go to the “Recorder” tab. Here you can record audio of how quickly your resource responds to user actions. Alternatively, you can record the process of adding an item to your cart, placing an order, etc. If you wish, you can simulate low Internet speed, which will allow you to see how all these tools will work in extreme conditions, and whether they will be able to satisfy user requests.
The resulting video recordings can be played back later to perform more comprehensive diagnostics. You can start the recording process in just a couple of clicks. Initially, go to the “Recorder” tab. and select “Start recording” from all the tools presented here.
Analyzing the stability of the site
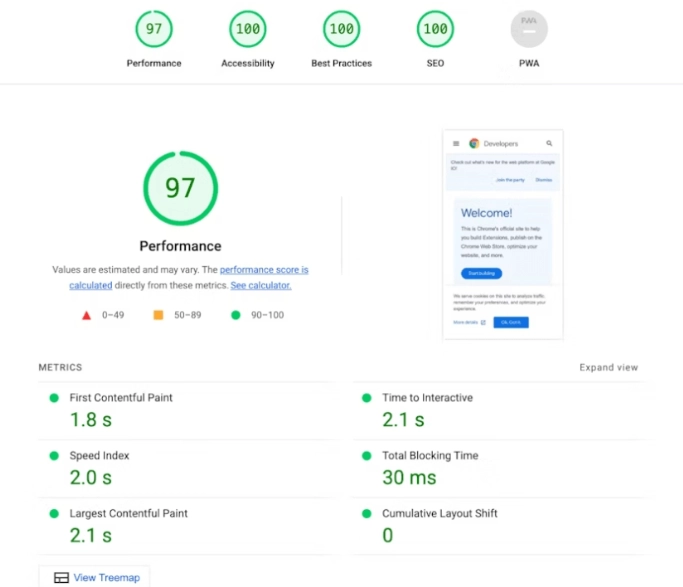
To solve this problem, DevTools offers many tools that you can find in the “Lighthouse” tab. With their help, you can check your resource and identify existing problems. In particular, it is possible to monitor the following parameters:
- the speed at which your portal loads and works;
- the extent to which it is adapted to work on various devices, be it smartphones or computers;
- correctness and attractiveness of the layout as a whole;
- correctness of SEO optimization performed.
You will also have the opportunity to check the site for error 200, which is provided by Progressive Web App support. Use the Best Practices tool to make sure your site is secure using the best online development standards.
In order for us to assess the complexity of the situation and potential dangers, the system evaluates all these indicators on a scale from 0 to 100. An additional color indication will help you navigate the numbers more easily. Thus, the most serious problems will be highlighted in red and have a score of less than 49 points. The system will highlight what is recommended to be adjusted in orange and assign a score in the range from 50 to 89. The absence of comments and a score of 90-100 points will be observed for parameters highlighted in green.
Checking site speed by users
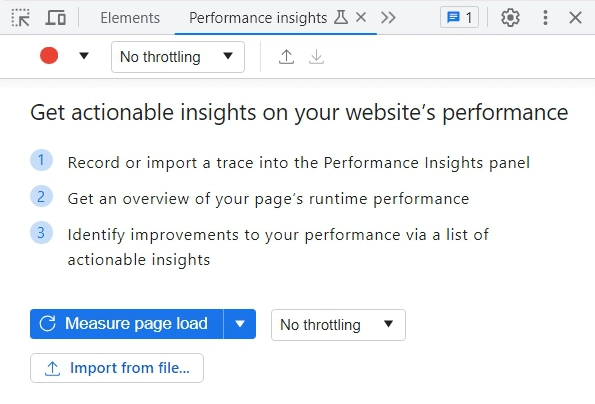
DevTools allow you to simplify the work of not only specialists, but also ordinary users. In particular, if they go to the “Performance Insights” tab from their Google Chrome browser, they will be able to measure the loading speed of a particular page. The system will automatically calculate the time spent on fully displaying the page, including all those interactive elements that are present on it, and loading related network resources.
To conduct this analysis, the tool enters the site on behalf of the user and simulates interaction with it. You can launch this tool through the DevTools “Performance insights” tab. Here we select the “Measure page load” option.
To summarize
As you can see, DevTools offers a huge number of tools for both website developers, marketers, and many other specialists who create, test, optimize and promote resources. Moreover, even ordinary network users will find useful solutions here. To launch all these tools in Google Chrome, you need to press the key combination “Ctrl + Shift + I”. This will open your browser's context menu.
If we analyze all the information we provided above, we can highlight a number of key aspects where the use of DevTools will be most useful:
- Checking the correct display of the site on certain devices. To do this, press the key combination “Ctrl + Shift + M” or click directly on the “Toggle device toolbar” option.
- Running the process of checking XPath requests, as well as their direct compilation. You will find the corresponding tools here in the “Elements” tab.
- Selecting the most optimal design by searching through all available options and comparing them. This way you can visually assess which option is the most attractive for you and take it as a basis.
- Taking different types of screenshots, from the entire screen with hidden links to a separate area with the ability to choose the most suitable option each time. To do this, you need to press the key combination “Ctrl+Shift+P”, enter the words “screenshot” in the search bar. and choose from the proposed options the one that will meet your needs at a given time.
- Determine the CMS of your resource, as well as what counters and pixels are installed on it at a given time. You will find all these tools in the “Sources” tab.
These are not all the tools that you can use in your activities. But how convenient, safe, and functional your work will be directly depends on the availability of reliable mobile proxies at your disposal, in particular the MobileProxy.Space service. They will be useful in the work of absolutely any specialist, as well as all those who would like to ensure a high level of confidentiality and security when working on the Internet.
Follow the link https://mobileproxy.space/en/user.html?buyproxy to get acquainted with all functionality of such a solution, available geolocations, current tariffs.
If you encounter any difficulties in your work, you will need professional help and competent advice, contact the technical support specialists at a time convenient for you.